

SIP Did Exactly What They Should
Recently, numerous articles have surfaced discussing how equity markets delivered zero returns over the past year. This has sparked considerable anxiety among investors. Just the other day, one of my wife’s cousins called her in distress. Her husband has been investing consistently in equities, and after reading the news, she became concerned about the possibility of losing their invested money. She even wondered if they should start looking for alternative opportunities.
Let’s Add Some Perspective
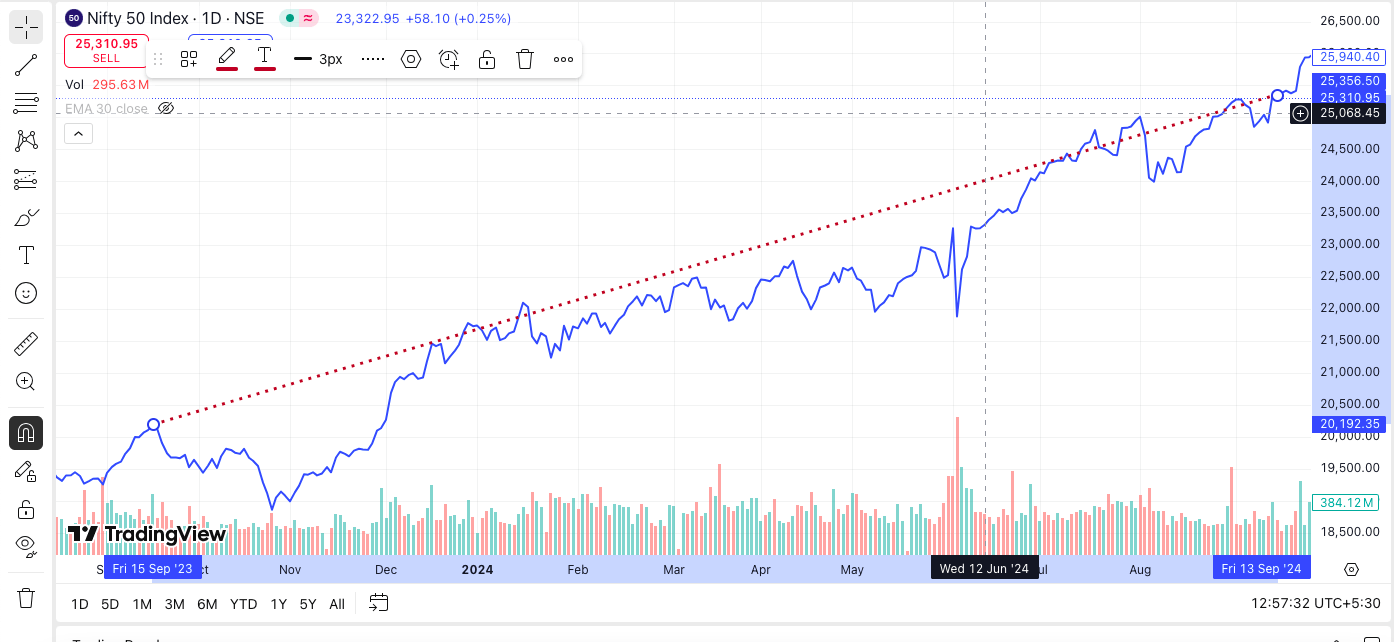
On September 15, 2023, the index stood at 20,192.35. By September 13, 2024, it had risen to 25,356.50—a one-year return of 24.85%. Such impressive gains from a large-cap index are certainly unusual. The graph below clearly shows the straight-line growth during that period. Unsurprisingly, this rally triggered a wave of new investors entering the market. Positive news was everywhere; no matter where you looked, optimism dominated.
This Trend Shifted the Following Year
However, the landscape changed dramatically over the next year as the market corrected and fell from its peak. I discussed this shift in detail on my blog (Your SIP During Market Corrections: A Perspective From Your Advisor), as well as in a LinkedIn post (see here).
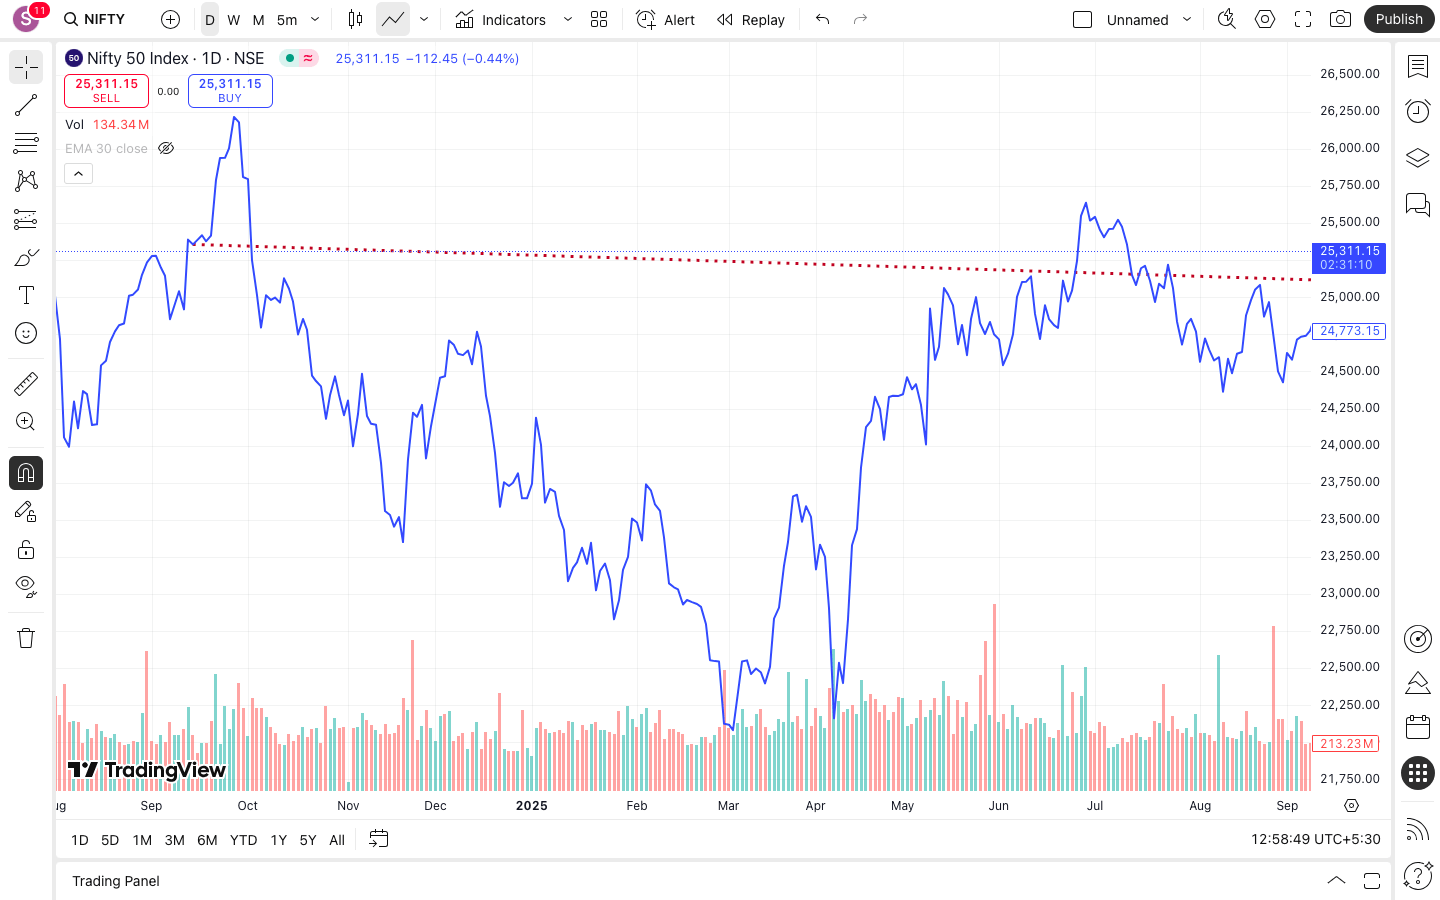
Although the market has begun to recover since the correction, returns for investors have remained flat. On September 13, 2024, the Nifty50 was at 25,356.50. By September 15, 2025, it stood at 25,069.20, reflecting a negative return of 1.13% over the year (see the chart below).
But What About SIP Performance?
To truly understand how Systematic Investment Plans (SIPs) performed during this period, let’s consider a real-world example. For the sake of neutrality, the name of the fund has been omitted to avoid making any specific recommendations.
| Nav Date | Nav | Cumulative Units | Cumulative Invested Amount | Market Value |
| 15-09-2023 | 80.83 | 247.433 | 20,000 | 20,000 |
| 16-10-2023 | 79.63 | 498.594 | 40,000 | 39,703 |
| 15-11-2023 | 80.44 | 747.227 | 60,000 | 60,107 |
| 15-12-2023 | 87.66 | 975.381 | 80,000 | 85,502 |
| 15-01-2024 | 90.77 | 1,195.718 | 1,00,000 | 1,08,535 |
| 15-02-2024 | 93.13 | 1,410.472 | 1,20,000 | 1,31,357 |
| 15-03-2024 | 93.79 | 1,623.714 | 1,40,000 | 1,52,288 |
| 15-04-2024 | 95.54 | 1,833.051 | 1,60,000 | 1,75,130 |
| 15-05-2024 | 96.88 | 2,039.492 | 1,80,000 | 1,97,586 |
| 18-06-2024 | 102.14 | 2,235.301 | 2,00,000 | 2,28,314 |
| 15-07-2024 | 106.71 | 2,422.725 | 2,20,000 | 2,58,529 |
| 16-08-2024 | 106.71 | 2,610.149 | 2,40,000 | 2,78,529 |
| 16-09-2024 | 110.52 | 2,610.149 | 2,40,000 | 288,473.67 |
SIP Performance During the Rally
From September 15, 2023, to September 16, 2024, an investor making regular SIP contributions would have seen their investment table look somewhat like this:
During this period, SIP investors achieved an impressive XIRR of 38.92%. This remarkable return was possible because the markets were on an upswing, providing an environment where gains were highly likely.
But why did the SIP’s XIRR outperform the market’s absolute return during this time?
The key lies in understanding the difference between XIRR and absolute returns. While absolute returns simply measure the point-to-point change in value, XIRR accounts for the timing of each cash flow—capturing the compounding effect of investing regularly throughout the year.
When comparing absolute numbers, the market delivered a return of 24.85%, while the fund’s absolute gain stood at 20.19%. In rising markets, SIPs typically underperform in absolute terms because the investments made later in the year buy at higher prices. However, XIRR can look higher over short, sharply rising periods due to the sequence and timing of flows.
| Nav Date | Nav | Cumulative Units | Cumulative Invested Amount | Market Value |
| 16-09-2024 | 110.52 | 180.963 | 20,000 | 20,000 |
| 15-10-2024 | 109.42 | 363.745 | 40,000 | 39,801 |
| 18-11-2024 | 103.01 | 557.900 | 60,000 | 57,469 |
| 16-12-2024 | 108.16 | 742.812 | 80,000 | 80,343 |
| 15-01-2025 | 101.13 | 940.577 | 1,00,000 | 95,121 |
| 17-02-2025 | 99.97 | 1,140.637 | 1,20,000 | 1,14,029 |
| 17-03-2025 | 98.15 | 1,344.407 | 1,40,000 | 1,31,954 |
| 15-04-2025 | 102.47 | 1,539.586 | 1,60,000 | 1,57,761 |
| 15-05-2025 | 109.37 | 1,722.451 | 1,80,000 | 1,88,384 |
| 16-06-2025 | 109.44 | 1,905.200 | 2,00,000 | 2,08,505 |
| 15-07-2025 | 110.79 | 2,085.722 | 2,20,000 | 2,31,077 |
| 18-08-2025 | 110.8 | 2,266.227 | 2,40,000 | 2,51,098 |
| 15-09-2025 | 111.14 | 2,266.227 | 2,40,000 | 2,53,507.98 |
SIP Performance for Investors Starting at Market Peaks
What if an investor entered the same fund at the market peak, amid all the hype? Let’s explore what would have happened in that scenario.
The fund delivered an XIRR of 10.56%, despite the market’s absolute returns being negative at -1.13%. How is this possible?
Looking at absolute returns, the fund generated a positive 5.62%, compared to the Nifty50 index’s -1.13% during the same period.
This advantage arose because investments were made during a market decline, allowing the investor to buy at lower NAVs. For example, on February 17, 2025, the NAV was 99.97, significantly lower than the NAV of 110.52 on September 16, 2024. This enabled the purchase of more units at discounted prices. Similarly, other instances of market dips allowed SIP investors to accumulate more units, resulting in SIPs delivering superior returns during market downturns.
| Nav Date | Nav | Cumulative Units | Cumulative Invested Amount | Market Value |
| 15-09-2023 | 80.83 | 247.433 | 20,000 | 20,000 |
| 16-10-2023 | 79.63 | 498.594 | 40,000 | 39,703 |
| 15-11-2023 | 80.44 | 747.227 | 60,000 | 60,107 |
| 15-12-2023 | 87.66 | 975.381 | 80,000 | 85,502 |
| 15-01-2024 | 90.77 | 1,195.718 | 1,00,000 | 1,08,535 |
| 15-02-2024 | 93.13 | 1,410.472 | 1,20,000 | 1,31,357 |
| 15-03-2024 | 93.79 | 1,623.714 | 1,40,000 | 1,52,288 |
| 15-04-2024 | 95.54 | 1,833.051 | 1,60,000 | 1,75,130 |
| 15-05-2024 | 96.88 | 2,039.492 | 1,80,000 | 1,97,586 |
| 18-06-2024 | 102.14 | 2,235.301 | 2,00,000 | 2,28,314 |
| 15-07-2024 | 106.71 | 2,422.725 | 2,20,000 | 2,58,529 |
| 16-08-2024 | 106.71 | 2,610.149 | 2,40,000 | 2,78,529 |
| 16-09-2024 | 110.52 | 2,791.112 | 2,60,000 | 3,08,474 |
| 15-10-2024 | 109.42 | 2,973.894 | 2,80,000 | 3,25,403 |
| 18-11-2024 | 103.01 | 3,168.050 | 3,00,000 | 3,26,341 |
| 16-12-2024 | 108.16 | 3,352.961 | 3,20,000 | 3,62,656 |
| 15-01-2025 | 101.13 | 3,550.726 | 3,40,000 | 3,59,085 |
| 17-02-2025 | 99.97 | 3,750.786 | 3,60,000 | 3,74,966 |
| 17-03-2025 | 98.15 | 3,954.556 | 3,80,000 | 3,88,140 |
| 15-04-2025 | 102.47 | 4,149.735 | 4,00,000 | 4,25,223 |
| 15-05-2025 | 109.37 | 4,332.600 | 4,20,000 | 4,73,857 |
| 16-06-2025 | 109.44 | 4,515.349 | 4,40,000 | 4,94,160 |
| 15-07-2025 | 110.79 | 4,695.871 | 4,60,000 | 5,20,256 |
| 18-08-2025 | 110.8 | 4,876.376 | 4,80,000 | 5,40,302 |
| 15-09-2025 | 111.14 | 4,876.376 | 4,80,000 | 5,41,960.43 |
Long-Term SIP Returns in a Volatile Market
To understand how long-term investors fared using the SIP route, let’s take a look at the overall returns generated over the two-year period shown in the table above.
Despite the volatility in the market, the fund was able to deliver a commendable XIRR of 12.10%, compared to an 11.42% return from the Nifty50 index during the same timeframe. This demonstrates how disciplined SIP investing can generate competitive returns even in uncertain market conditions.
Watch the Video :


Simran Kaur
October 7, 2025I really like the way you write your blog.
Dinesh
October 15, 2025Nice article, shows why SIPs work best over time, even when markets wobble.
admin
October 16, 2025Yes investing via SIP route in any financial instrument can help you build long term wealth .
Manish Choudhary
October 15, 2025Thanks for this — it helped me see how disciplined investing can smooth out ups and downs.
admin
October 16, 2025This blog and and https://wealthinn.in/your-sip-during-market-corrections-a-perspective-from-your-advisor/ were my attempts to highlight how the SIP investments work in real time. It has highlighted each and every aspect . Last year we seen a downturn in market followed by consolidation which is very important from investors perspective to learn about the markets and growth.
Aviraj Sharma
October 15, 2025Good read! The comparison of SIP vs absolute returns was eye-opening.
Dheeraj Gupta
October 16, 2025Makes sense, risk management and choosing insurance are important pieces I hadn’t thought much about.
Akhil Rana
October 16, 2025Good point about reducing stress — having expert help can take a lot off your plate.
Lokesh Kumar
October 16, 2025Nice article — the role of tax optimisation is something I want to learn more about.